Debugging
Start by switching to debug mode using the menu Debug | Toggle Debugging (Ctrl + Shift + D). A default window layout will appear. Move, close and resize to your preferences.
Breakpoints and conditional breakpoints are set using the mouse on the vertical bar next to row numbering. Can also be switched on/off using F9 for the line where the cursor is at.
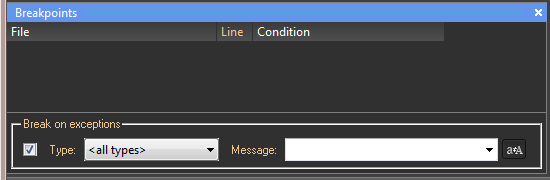
All breakpoints are displayed in the Breakpoints window. Also, breakpoints in the library files will show here. If an invalid breakpoint is set, it will show as an empty circle.
Conditional breakpoints
To create a conditional breakpoint, simply enter a valid logical expression directly in the Breakpoints window box, in the Condition column.
Conditional breakpoints will be market with a plus in the red circle.
Tip
As the conditional breakpoints are code lines that are actually compiled into the code at the point where inserted, any valid Qlang expression can be used given that it returns a logical. Example: v_size(vect) > 2 && vect[0] != 0.
Breakpoints can be stored on file, shared and loaded into other Quantlab sessions. This can be done using the menu Debug | Import / Export Breakpoints.
As a complement to setting break points manually, “Break on exceptions” can be configured so that it automatically breaks on a certain exception. Filter can be set on a specific type and/or thrown message.
Multi-thread debug
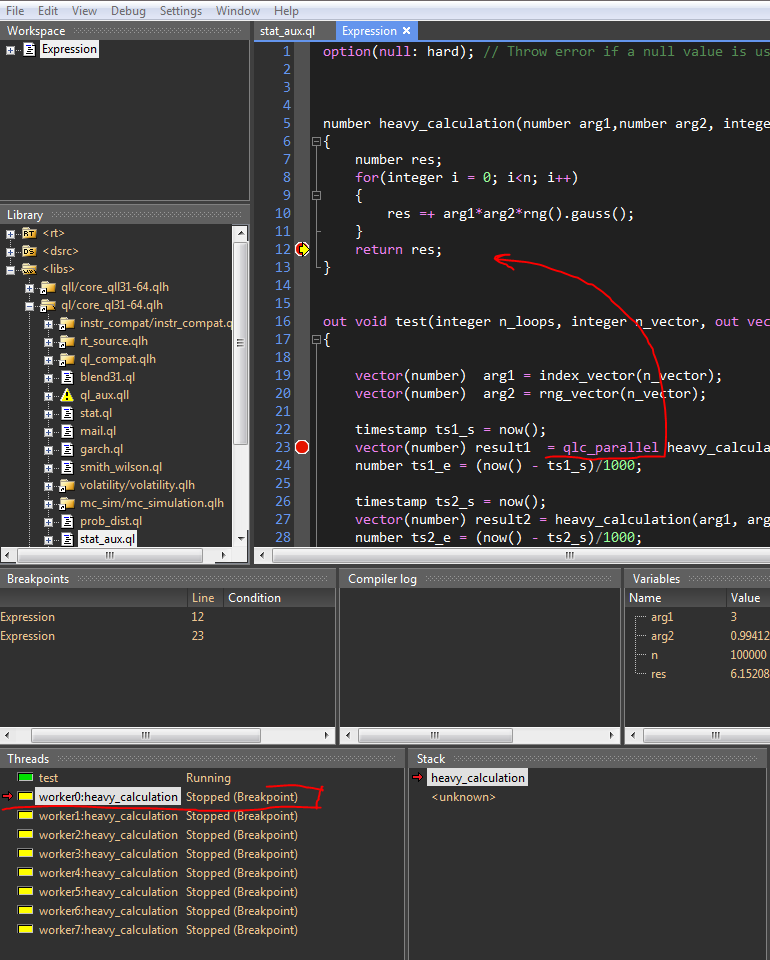
If running a multi-threaded program, each individual thread can be debugged using the list in the Threads window.
If a breakpoint is inserted in the function that is evaluated using multiple parallel threads. A list will appear. Initially, the pointer will be on the main worker thread, and not show the yellow stop cursor. By dubbel clicking on any of the threads in the window, its location and variable contents will show.
F5 will continue only the highlighted thread, Shift + F5 all threads, and Ctrl + F5 all but the highlighted thread. Note that when continuing a worker thread individually, it will finish the task for all threads. However, the results will not be released and displayed in the output until also the other threads are released from their respective breakpoints even though there is no more work to perform.
Watches
In previous versions of Quantlab, the way to view and interact with a variable during debug was via the Immediate window. This has now been replaced by the Watches window, having the same functionality. The expression can be any type of valid Qlang code, at minimum showing variable’s contents when stepping in the function.
Note that the watch expressions will stay in the Watch window even though stepping out of scope for that particular variable. It will then show “Undeclared identifier” if not yet passed or just null value.
Variables
In the variables window, all variables in a debug function will display their contents. It will try to show both simple types and object types if possible. For viewing your own class members etc please view the section on “Adding custom debug value browsing“ below.
Note that you can interact with the values in the variables by simply editing in the control-box. This is equivalent to how the “Immediate” window used to work.
Adding custom debug value browsing
When working with objects and classes, the default is to show the class
name in the Variables view and the Tooltip when debugging. By adding
your own custom debug value functions, __dbg_print(), and
__dbg_browse() to your class, the chosen member values will show in
both Tooltips and Variable view. This can be very useful when working
and debugging large data structures that is frequently visited. Using
the auxiliary custom defined browse and print, a particular class data
is easily found.
The double underscore prefix ensures that these member functions are automatically hidden from code completion and function browser view.
Below is a complete mock-up example of adding the __dbg_print() and
__dbg_browse() to a simple class.
class my_instr
   option(category: "Curve and Instrument")
{
   public:
      my_instr(string ric, date d, string fid);

      integer id();
      string name();
      number quote();

      void __dbg_print(__dbg_label);
      void __dbg_browse(__dbg_split);

   public:
      integer id_;
      string ric_;
      date d_;
      string fid_;
      number quote_;
};

my_instr my_instr(string ric, date d, string fid = "22")
   option(category: "Curve and Instrument")
{
   return new my_instr(ric, d, fid);
}

my_instr.my_instr(string ric, date d, string fid)
: id_(-1),
   ric_(ric),
   d_(d),
   fid_(fid),
   quote_(rt.get_num(ric, fid, "RFA", "IDN_SELECTFEED"))
{
   switch (ric)
   {
      case "SEK=": id_ = 101; break;
      case "EUR=": id_ = 102; break;
      case "GBP=": id_ = 103; break;
      case "NOK=": id_ = 104; break;
      case "JPY=": id_ = 105; break;
      case "AUD=": id_ = 106; break;
   }
}

integer my_instr.id()
{
   return id_;
}

string my_instr.name()
{
   return ric_;
}

number my_instr.quote()
{
   return quote_;
}

void my_instr.__dbg_print(__dbg_label l)
{
l.set_text(strcat(["my_instr { id: '", string(id_), "', ric: '",
                   ric_, "', date: #", string(d_), " }" ]));
}

void my_instr.__dbg_browse(__dbg_split s)
{
   s.resize(5);

   s.set_text(0, "id");
   s.set_value(0, id_);

   if (id_ < 0)
      s.set_hl(0, __dbg_hl.INACTIVE);

   s.set_text(1, "ric");
   s.set_value(1, ric_);

   s.set_text(2, "date");
   s.set_value(2, d_);

   s.set_text(3, "fid");
   s.set_value(3, fid_);

   s.set_text(4, "quote");
   s.set_value(4, quote_);
}
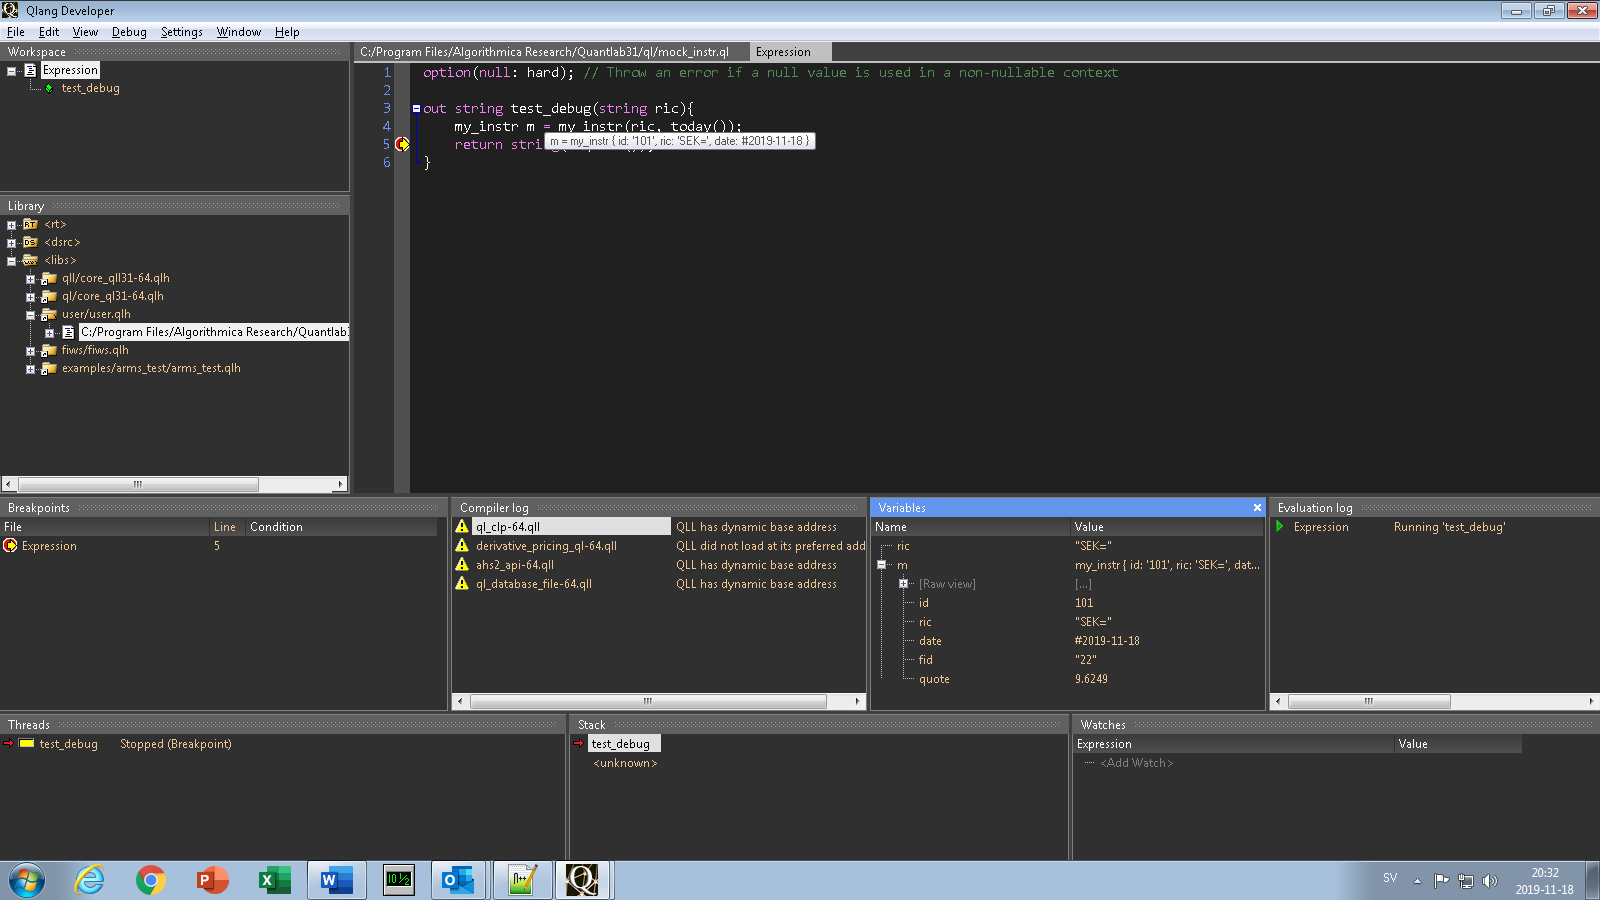
Result of running the mock example above (note also the tooltip on mouse over)