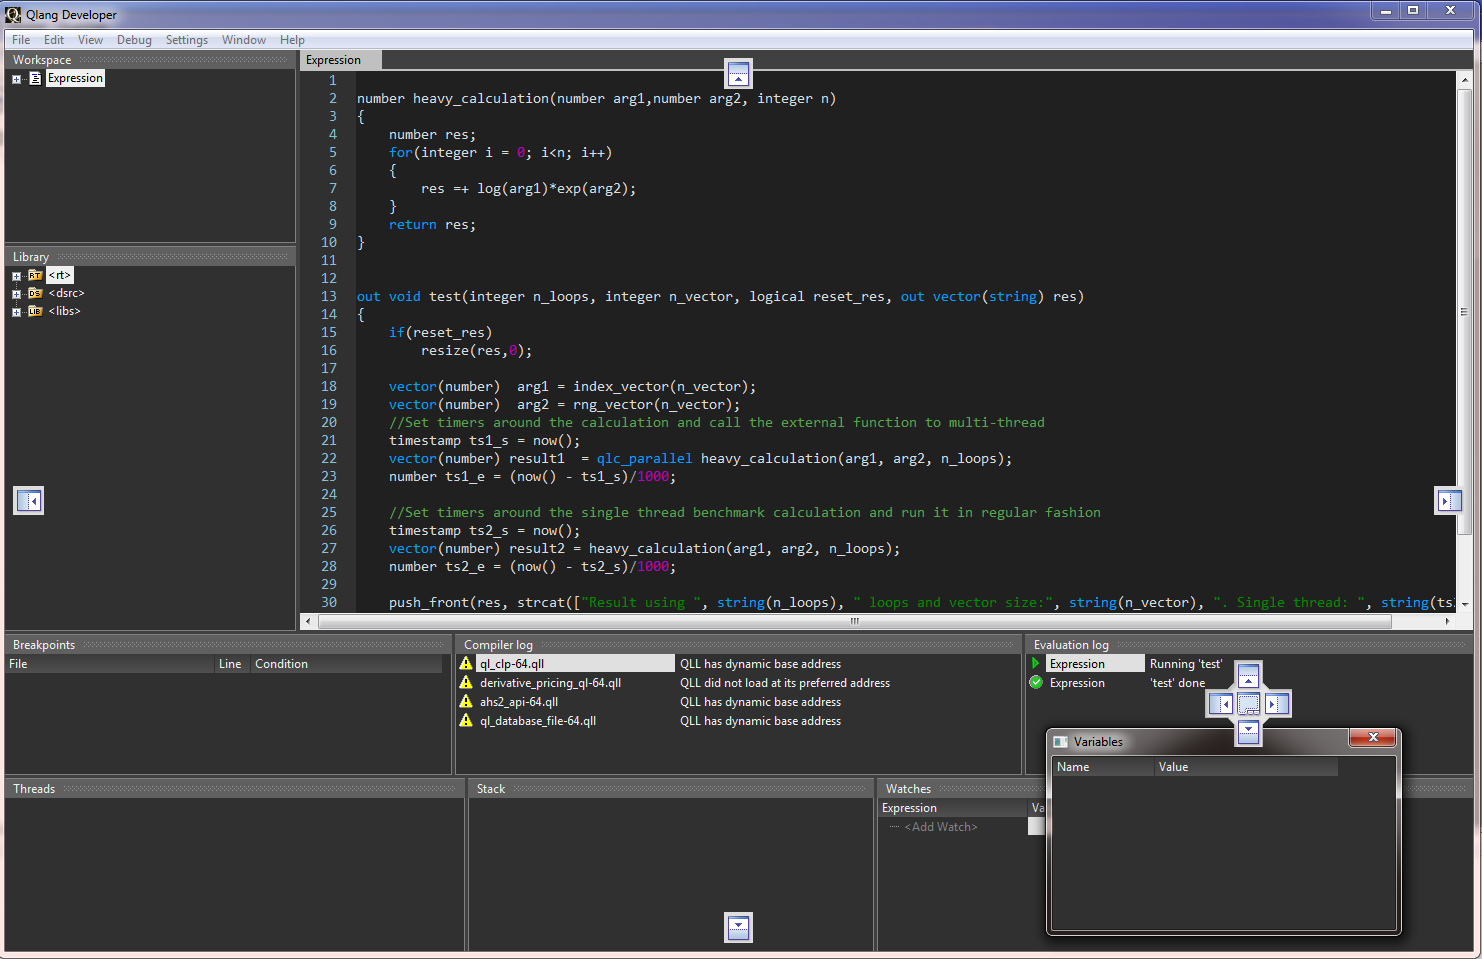
The controls
By switching to debug mode using menu Debug | Toggle debugging (or ctrl + shift + D) will open a predefined set of small working windows. All can be moved around be simply grabbing the header frame and undocking or docking within the lager window. A set of guiding docking markers will assist.

Windows can be switched on/off using the View menu or by simply detaching and closing them. Settings will be remembered between sessions in the user registry.
Following is a list of widows and their purpose:
Name |
Usage |
|---|---|
MainEditor |
The editor window itself. Can be split into multiple windows both horizontal and vertically split. |
Workspace |
Displaying all Expression code files in a particular workspace |
Library |
Showing the library code tree. Right click in the tree to also see built-in functions. |
Breakpoints |
Display all break-points and set optional break conditions. |
Threads |
View running threads and manage in which thread to debug. |
Compilerlog |
Show all compiler messages. Double click to go to any compilation errors. |
Stack |
View call stack when debugging. |
Watches |
Add watches for variables and expressions when stepping through code. (Replaces the “Imimageste window” of the old debug environment.) |
Evaluationlog |
Run-time messages from running the code. |
Variables |
List of variables and their in-scope values. Displays both scalar and vector values. |
Profiler |
Opens when toggling to File | Toggle Profiling (ctrl + shift + P). Used for performance profiling. |