Using the Profiler
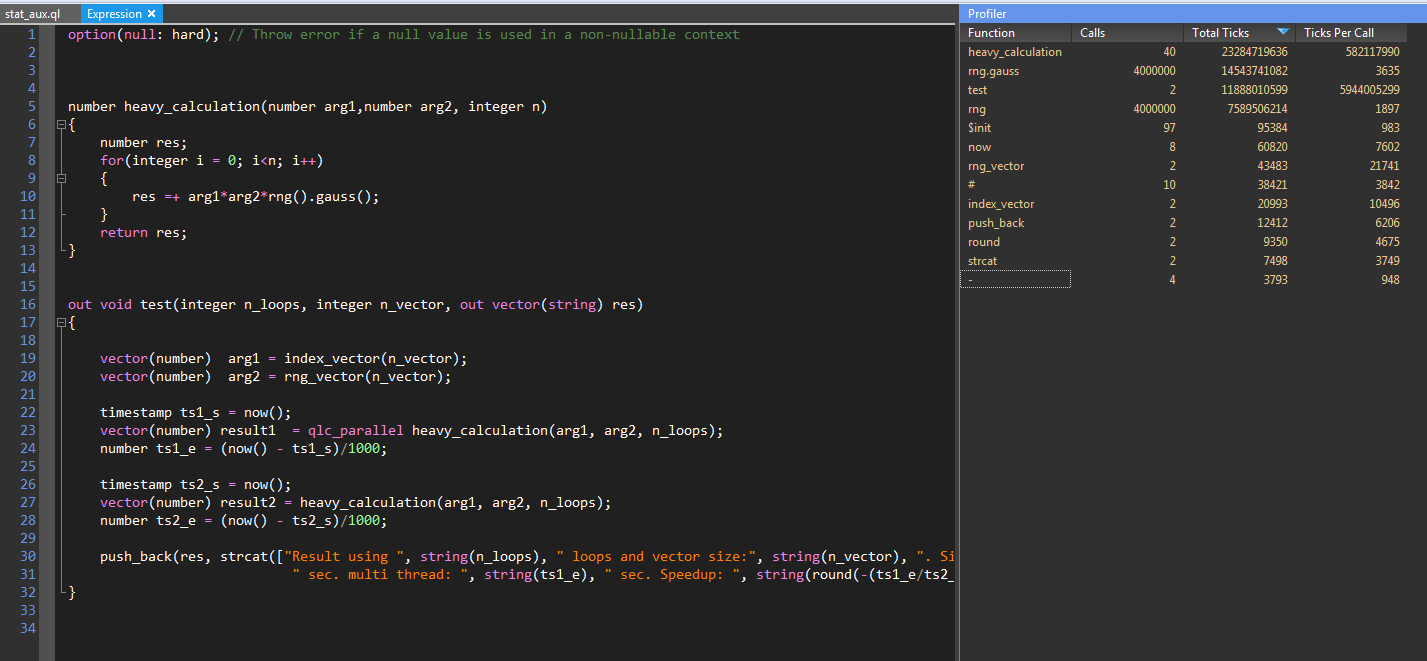
Open the profiler using menu View | Profiler (or Ctrl + Shift + P).
In profile mode there are two options, showing the results for each run and then resetting the counter, or aggregated with total and average run times. To change between the two, right click on the Profiler pane and choose to Accumulate or not. Here you may also clear the results and start over.

In the Profiler window you will see;
Which function that is called
How many calls that was made
Total number of Ticks (CPU cycles)
Number of Ticks (CPU cycles) per call
Sort by clicking on the appropriate column header.