Development environment
The development environment is designed with the specific requirements of the financial analyst in mind. Traditionally the quantitative analyst has used a combination of development tools including mathematical software packages, spreadsheets, C++ or Visual Basic to complete the work. Quantlab integrates a high level programming language with the possibility to add user-defined functions or classes from C++ or any COM compliant programming language. Quantlab handles all database interaction and real time connections.
Starting and quitting Quantlab
Starting Quantlab
Start Quantlab by double-clicking on the Quantlab icon on your desktop. An empty workspace is automatically opened. To open an existing workspace file use File|Open. There are example workspaces in the folder Algorithmica Research\Quantlab\Examples\ Workspaces.
Note
Valid license! Quantlab requires a valid license in order to work. The license is connected either to the computer on which the software initially was installed on or to the user who initially signed for the product. Please contact your IT department to check which type of license you have.
Quitting Quantlab
You quit your Quantlab session by clicking on File | Exit in the main menu.
Quantlab workspace
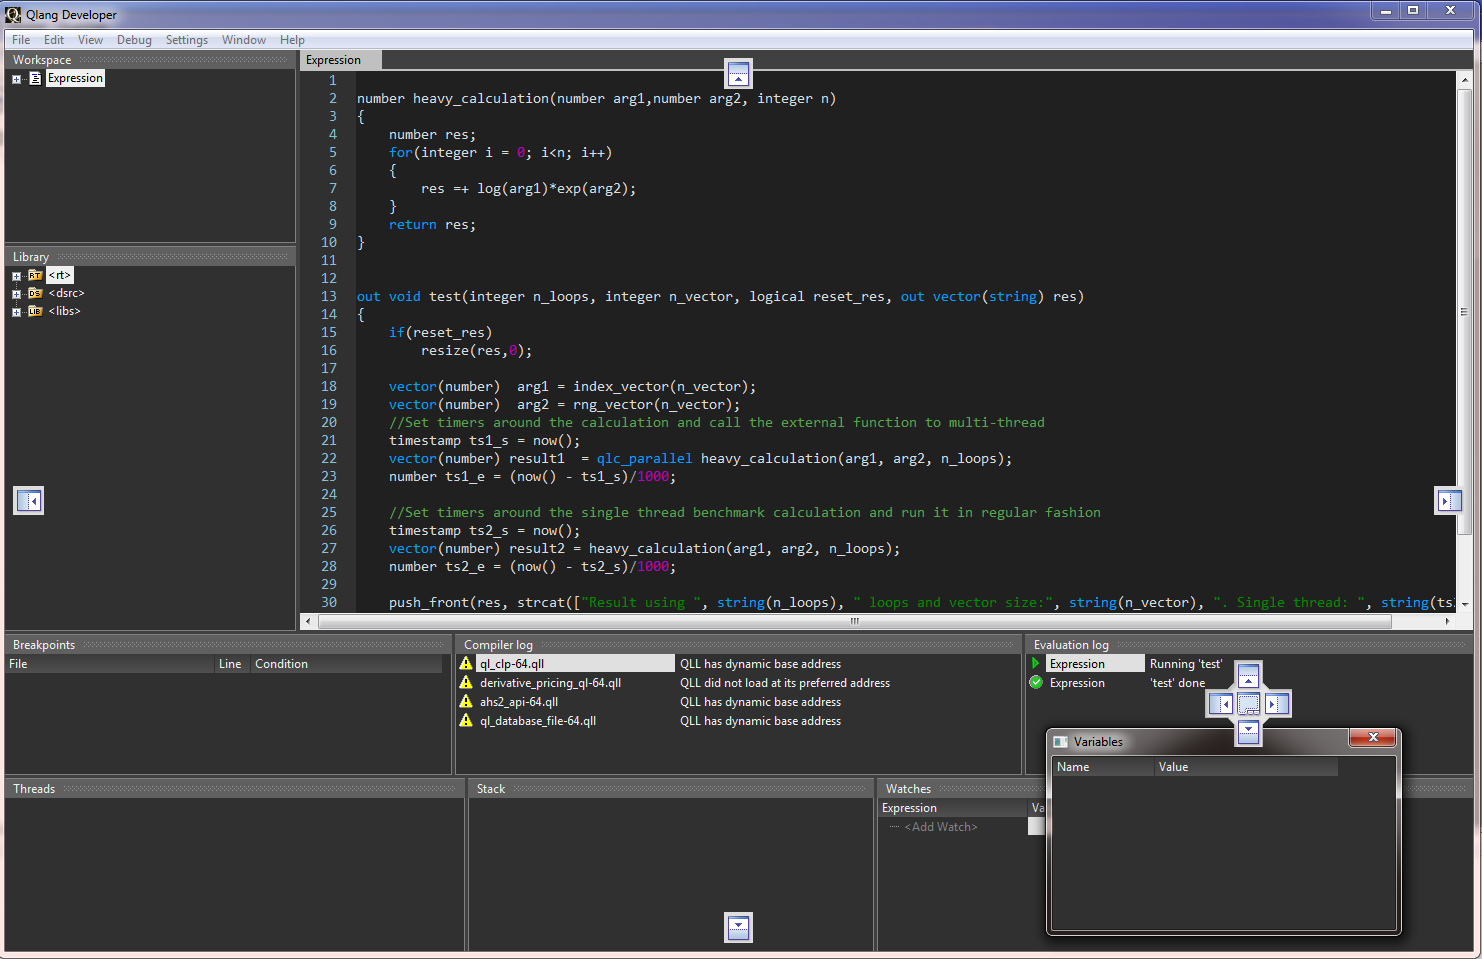
The Quantlab system has two faces, a developer environment and a user environment. The developer version work with a workspace and in parallel an Editor opened by Ctrl-L, designed for easy programming and testing. The Function Browser is found within the Editor window by pressing F1.
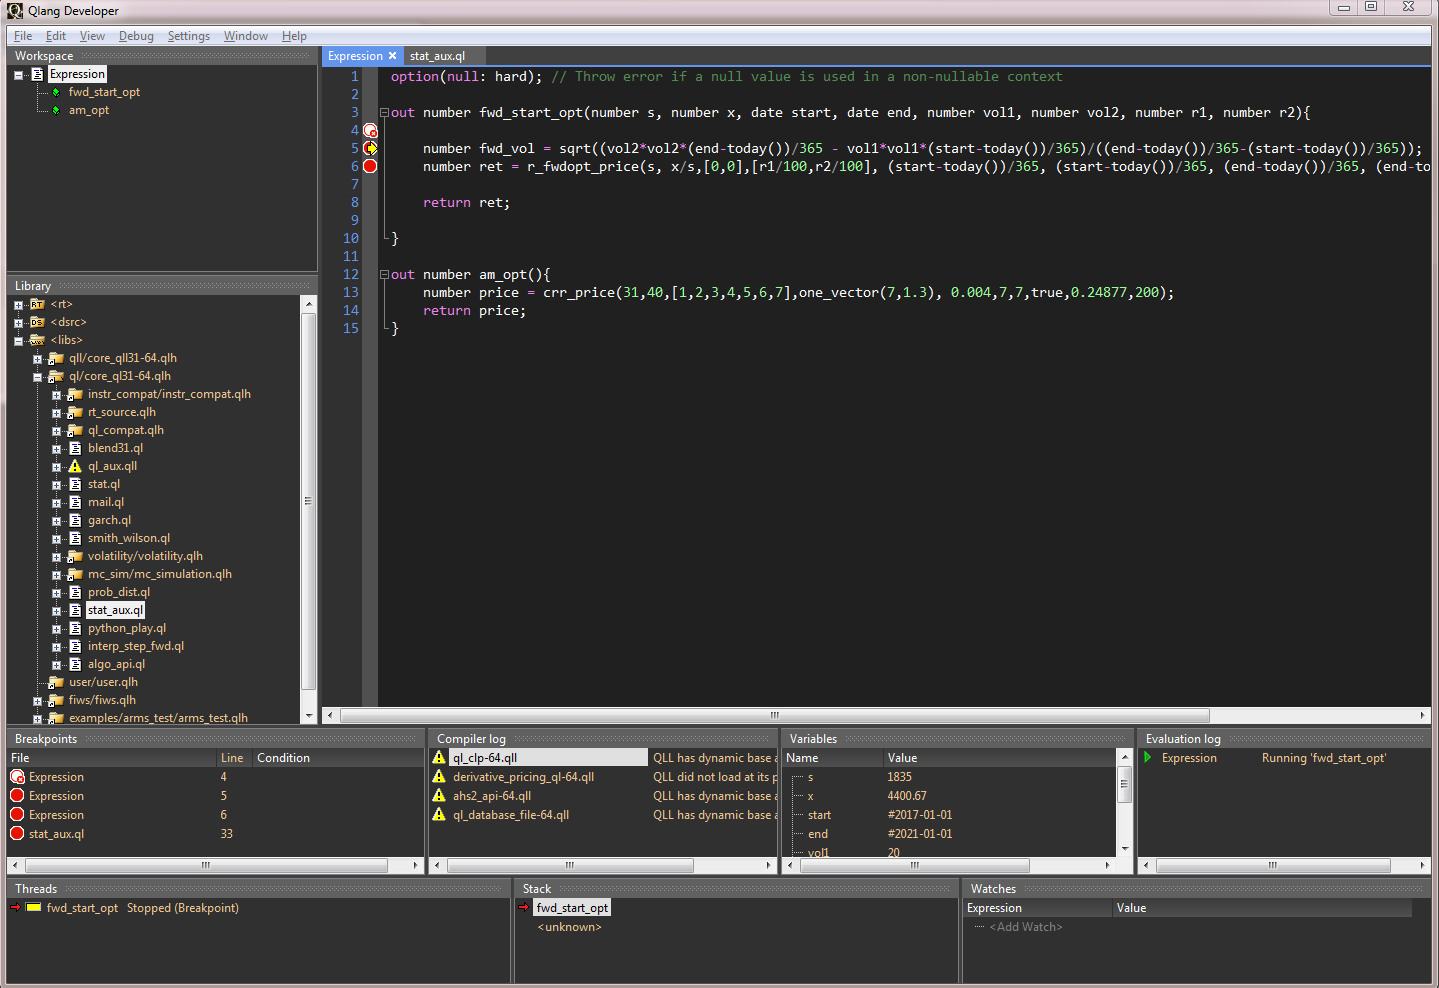
Workspace showing the main features of the developer edition
Windows within the workspace can be moved around freely. Windows with double bars on one edge dock to the side you move it to. To un-dock a window simply double click on the window side with double bars. If you do not want the window to dock, move it having the Ctrl button pressed down.
Workspace tools
Workspace browser
In the workspace browser you can organize your expressions, tables, and graphs into folders and tabs. On opening Quantlab an empty workspace will be created.
By right clicking with the mouse on the workspace icon you can insert folders to organize your project. To visually organize your tables and graphs in the workspace, you can insert tabs using Insert | Tab on the menu. Graphics and tables can then be dragged-and-dropped under a relevant tab.
Rename a folder, tab, expression, graph or table by right clicking on the object you want to edit. Right clicking also displays the most common properties of each object.
You can change the order among tabs by dragging and dropping: Use the left mouse button to drag a tab to the workspace symbol in the top of the workspace browser. This will put the selected tab last in the list.
Qlang Developer Editor
In the Editor you write the code to be executed and viewed in tables or graphs. It opens in a separate window using Ctrl+L, or Tools | Qlang Developer. Code written in the editor is saved in plain text so you can import and export this code to any text editor. To get help on using the built-in functions please see the Function browser (opens with F1).
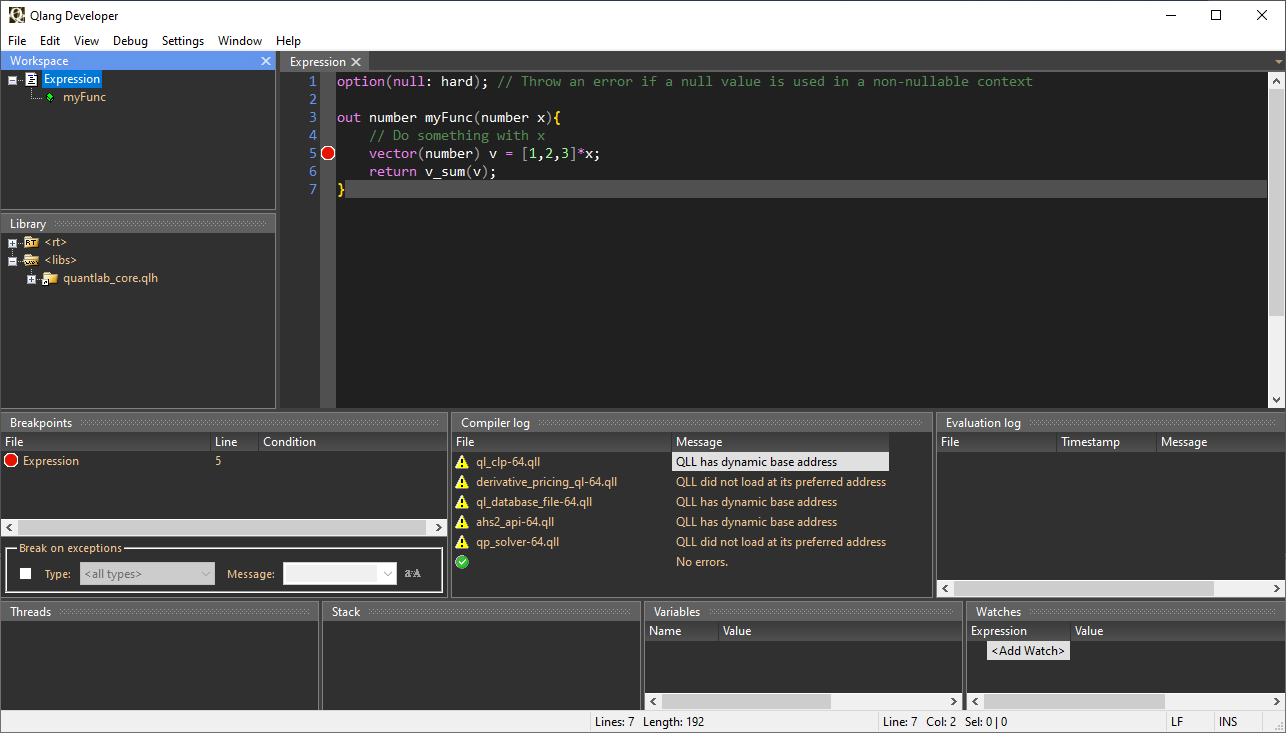
Coding help is available as colour-coded text, parenthesis checks, function parameter lookups, and object member lists.
Default colour codes:
Colour code |
Type of code |
|---|---|
Green |
Comments |
Blue |
Key words in Qlang |
Beige |
String |
Orange |
Unfinished string |
Green-blue |
Date |
Fluorescent-green |
Unfinished date |
Violet |
Number |
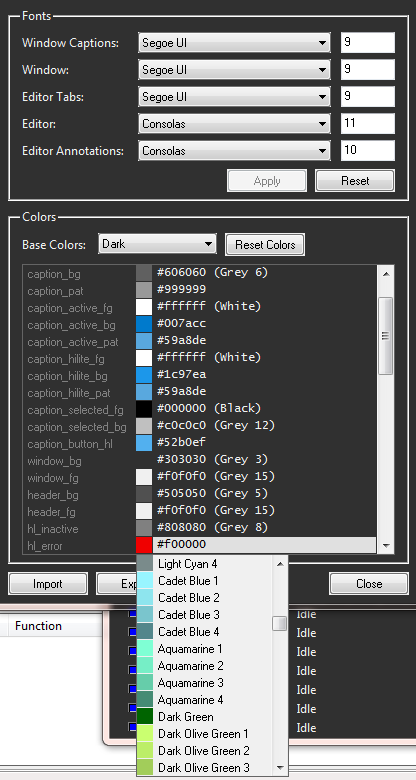
User defined settings for the Developer Editor can be found in the top menu Settings, and Settings | Appearance, where also background colour and indentation can be changed. Note that there are detailed descriptions in the separate document Quantlab Editor 3.1.x.pdf document.
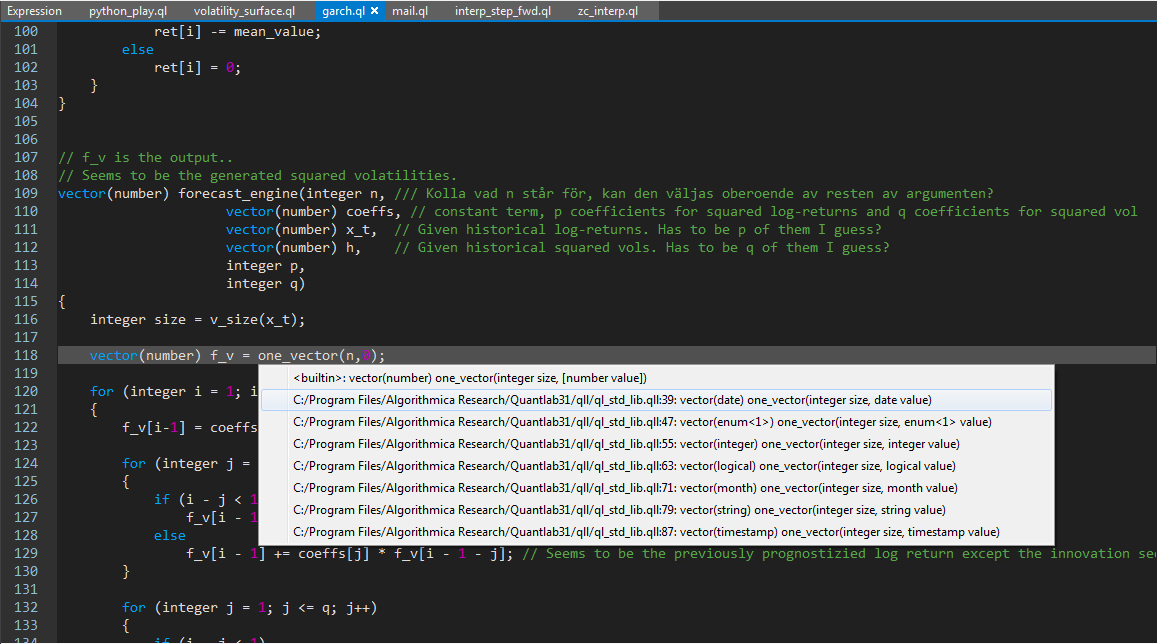
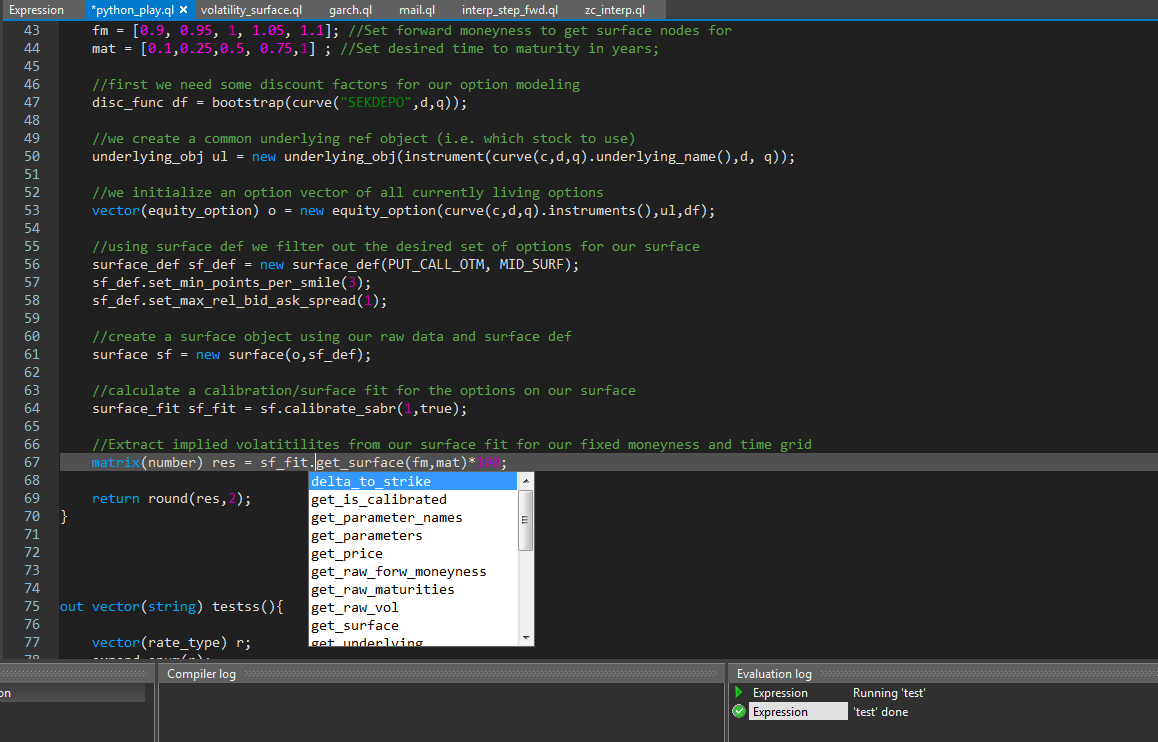
Tip
Useful tool-tip! To assist in entering built-in or user functions, a tool tip will be displayed when you enter the first left hand parenthesis of the function. All objects will show its member list when entering the dot after the name.
Function browser
An important part of the help that comes with Quantlab is the function browser. Press F1 or Help | Qlang documentation to open. All types, functions, objects, and members are displayed. If you write library files or program your own C++ functions using the Quantlab API, these functions will also show up in the function browser.
The left window will display all available objects, members and functions. The right-hand window will display the active functions’ overloaded variants including the type and name of the parameters.
Some functions have example code for ease of understanding. The help window is by default read directly from Algorithmica Research’ web servers. A locally stored help can be accessed by right-clicking in any top window and de-selecting “online help” in the menu. (If initially installed with the program.)
Tip
Speed tip! Using search and then clicking on a given found function, you will get to the place in the tree where that function is placed.
Real time quotes browser
When viewing any graph or table that includes today’s date, the real time browser will display real time data. By default, today’s date is used whenever you want to view real time data.
Only instruments relevant to the active graph or table will be displayed in the real time browser. In order to view real time quotes for another graph or table, simply click on it to make it the active window.
The order of the columns can be changed and switched on/off by right-clicking in the window and selecting “column properties”.
Example of the real time browser with instruments and quotes
The Stop check box will turn of all pass through of quotes to the analysis and code. The individual check boxes at the side of the instrument will stop only that instrument to update.
Note
It is no longer possible to override the quotes with user defined values directly in this window. In order to override quotes, code needs to be written using the “.set_quote()” function for the instrument.
Messages - warnings and run-time errors
There are two phases to programming and testing financial expressions in Quantlab. First the written expression must be syntactically correct. This is taken care of within the Qlang Developer Editor and compiler. Secondly, the financial expression must make sense when used on real world data.
General settings for when and why the messages should display can be found in Tools | Options | Messages. Read further under In tab Messages:.
When running an expression window any run-time messages will show in the View | Messages tab.
Typical warnings occur when:
historical data is missing in the database
calculations fail due to missing data
required static data is missing for any instrument
By right clicking on the warnings, copy, clear and remove functions appear.
Progress list
Workspaces can eventually contain hundreds of expression that will be evaluated each time any parameters or quotes change. The progress list will display which expressions that currently are being re-calculated.
For each graph or table a star (*) in the window header is shown as long as there is at least one attachment that is still calculating.
To manually stop the execution of an expression, right click on the expression attached to a specific graph or table in the workspace browser and press Stop. The evaluation cannot be stopped in the progress window.
Tip
Speed tip! If the computer starts to slow down due to extensive re-calculations, you can manually set a re-calculation frequency. Under the Tools | Options menu, the real time re-calculation frequency can be set to a higher number. For example, entering 10 seconds will drastically reduce the load.
Setting preferences (Tools)
Under the Tools Option menu, you will find some useful possibilities to set preferences for the general appearance of Quantlab, for the expression window and for paths when loading various library files.
Database options
The name of the ODBC data source that is used for retrieving all instrument and time series data. You can change the ODBC source and then press Reload in order to switch the database. This is equivalent to closing down Quantlab and re-open it with the current workspace.
In tab General:
Option to show a dialog when attaching functions to graphs or tables
Option to show a name dialog when creating a view (table or graph)
Option to calculate visible views only. Normally, this should be checked as it speeds up performance. If all views must be calculated at each relevant real time update, it should be unchecked.
Number of files in the recently used files list and the maximum number of characters used for the name and the paths in the menu.
Default quote side. When constructing an instrument or a curve you have several possibilities to set the quote side. However, often the quote side is an optional parameter and if it is not set, the default value defined in this dialog will be used.
Minimum time between calculations. Useful for reducing the number of recalculations when real time data is updated frequently. This is only used for the calculations, the Realtime Quotes window (see Real time quotes browser) will not be affected.
Save favourite real time instrument names (real time identification codes) for faster workspace start-up times. You set the number of days that Quantlab will save what instruments you have used. When the options is set at 1 or more days, on start-up Quantlab will request a subscription to these real time items even before you open a workspace. Often, this will drastically reduce the time it takes to open workspaces having many real time instruments. The accumulated history of real time items can be cleared by pressing the Clear button.
In tab Extended:
Maximum number of warnings. Put a limit on how many warnings will be written in the warnings window each time an attachment is evaluated. If the number of errors in your expressions or database is very large, the mere update of this window may be time consuming. In such a case it may be useful to limit the number of warnings until the errors are taken care of.
Calculation thread priority. This can be changed in order to let Quantlab get larger or smaller part of the CPU time of the computer.
In tab Messages:
Warnings, displaying run-time messages such as real-time data missing or non-evaluating functions.
Compiler messages and errors, displaying information from the compiling session.
The display level can be individually set to:
Always show
Show if message window visible
Don’t show
In tab Table:
Show errors messages. In some cases, errors may be specific for a cell in a table. To show all upcoming errors within the tables, click this check box.
Enable direct cell editing. If this is checked you can select a cell in an input column in a table and edit directly. Otherwise you have to double-click or use F2.
In tab Edit (for the expression editor):
Choice of indentation. Automatic indentation and tab length.
Debug windows. Number of decimals when showing numerical values of variables.
Colour display setting. Either use default setting or choose your own colours for different types of text in the expression windows.